Moving the boardroom conversation from understanding to taking action.
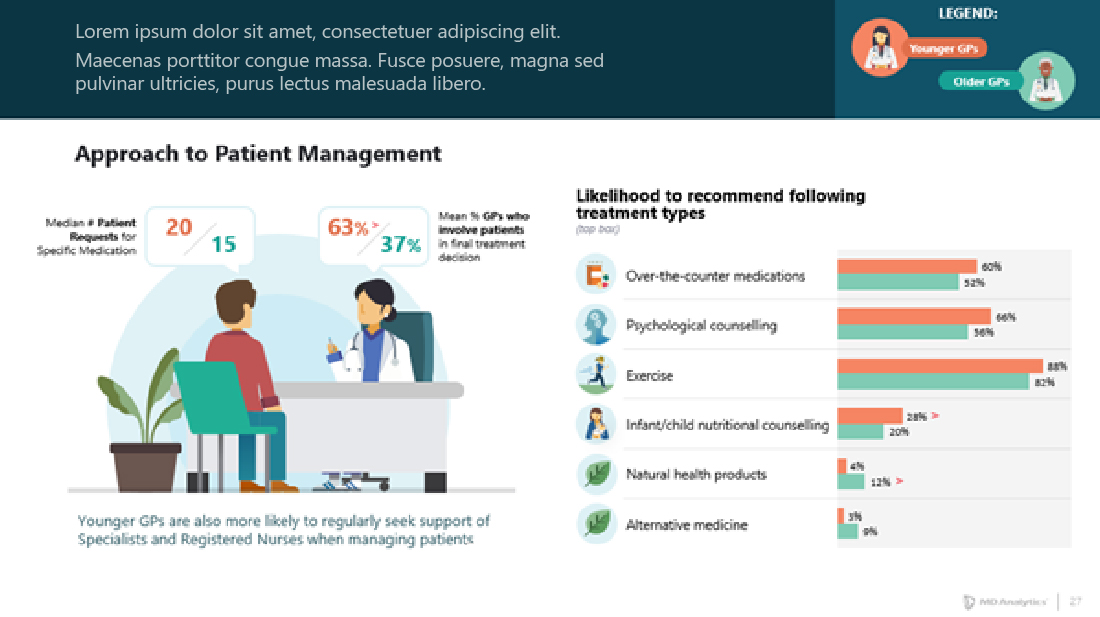
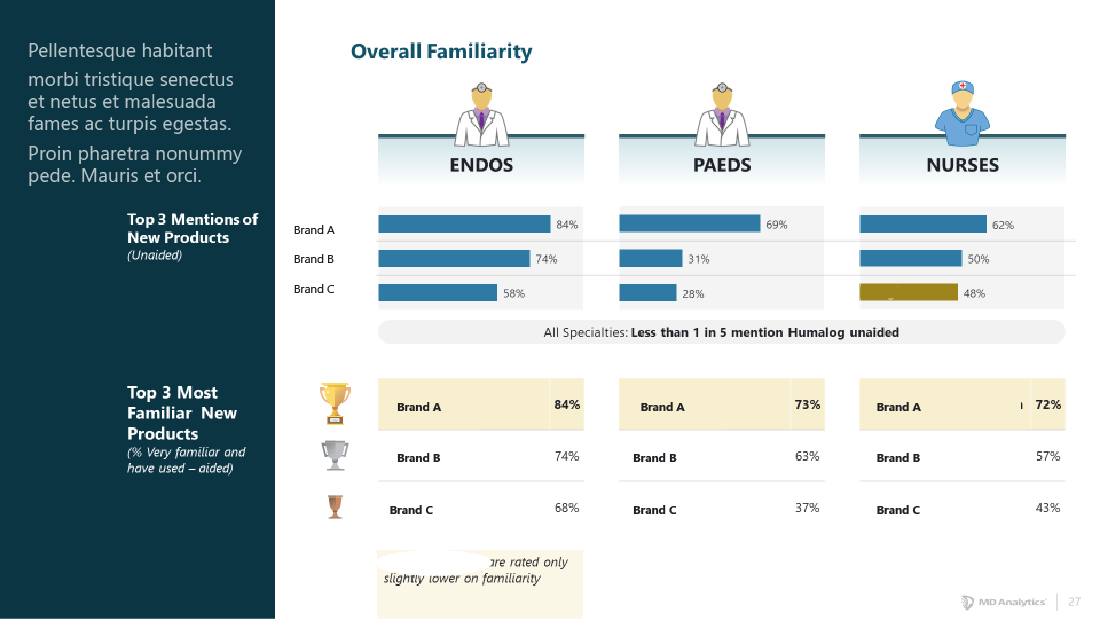
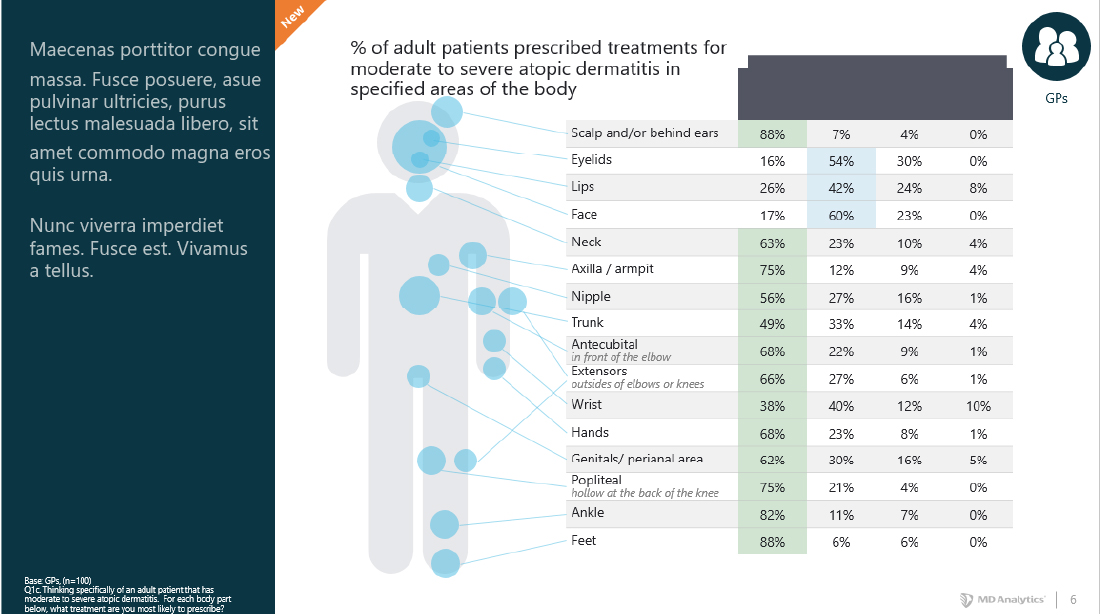
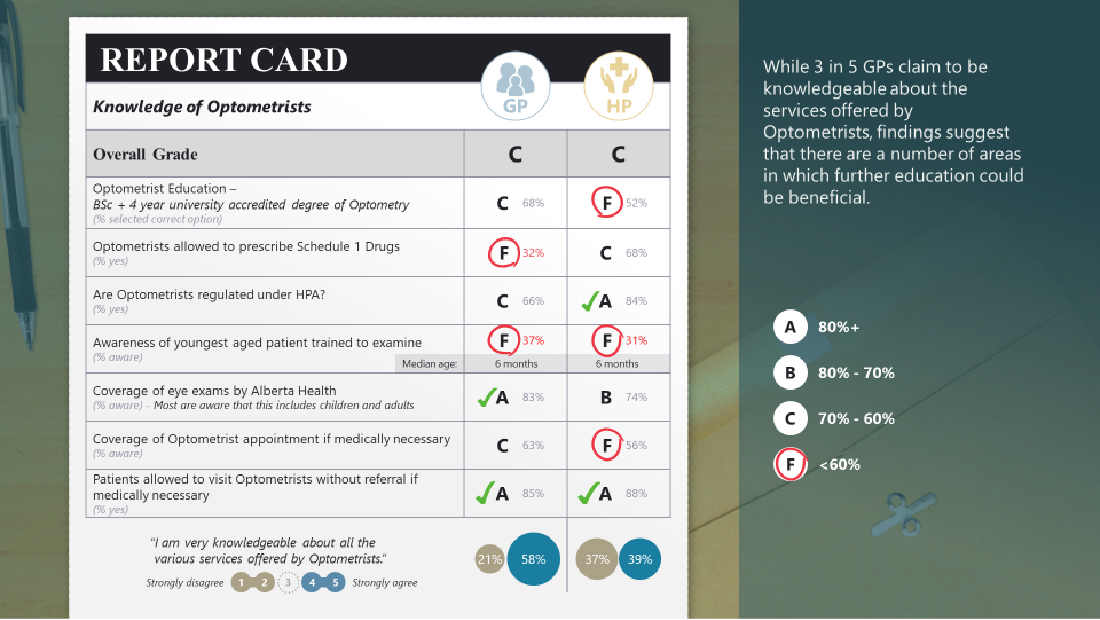
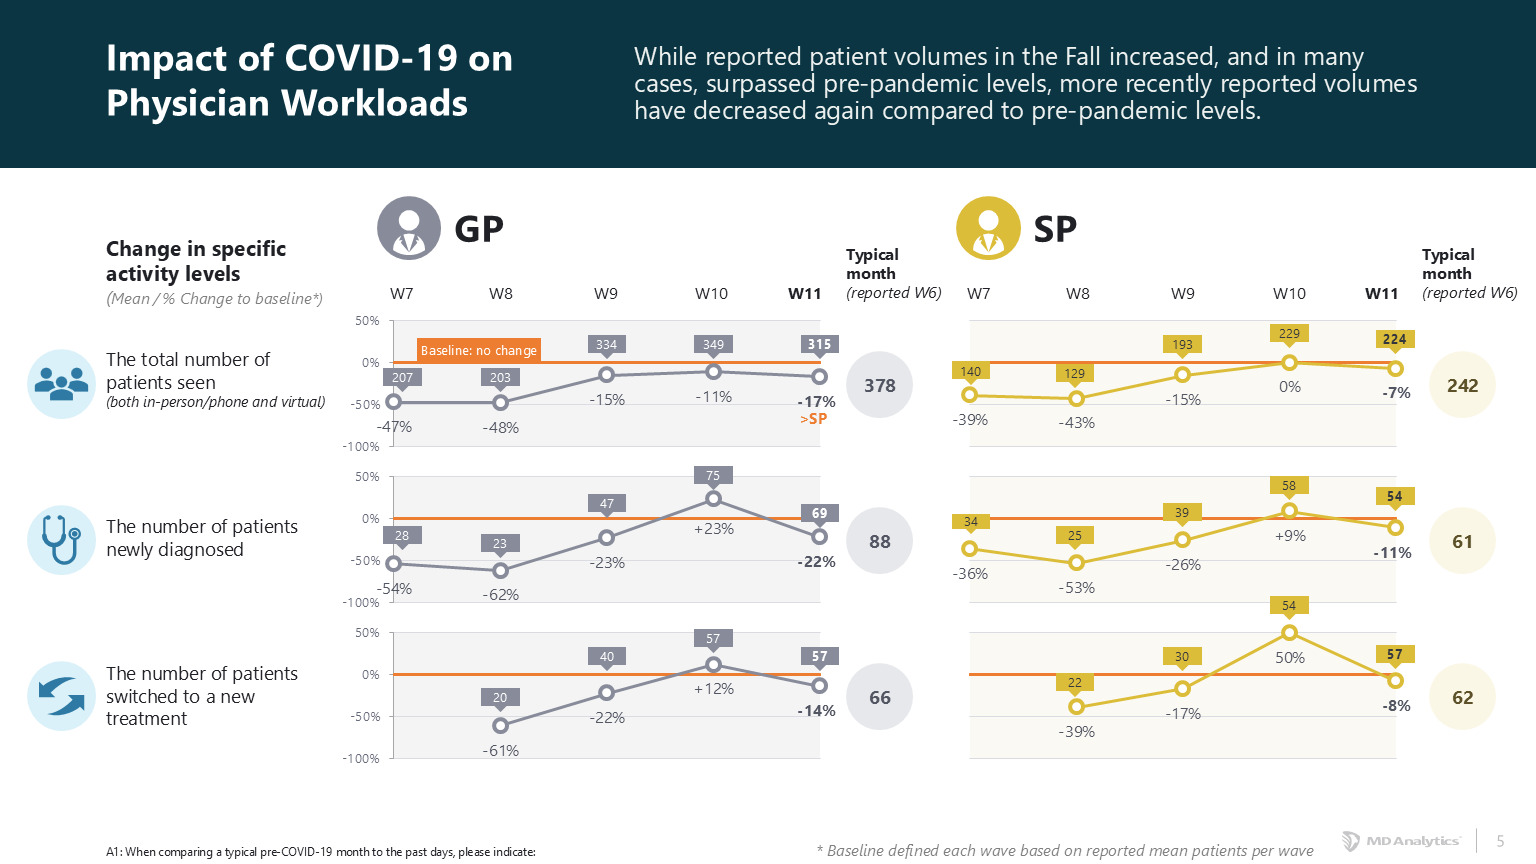
We understand how the use of visual aids and design principals can be used to dramatically improve the communication of complex data, and ultimately the customer experience. Our intuitive and highly visual, story-based reporting process produces polished, illuminating reports.
Intuitive Story-Based Reporting
Experience has shown that the longer it takes for someone to decipher market research findings, whether that’s understanding the information being presented in a chart, or determining who the data is referring to, the more likely they are to lose interest or question the integrity of the research.
During presentations, we distill the most relevant data into a narrative sequence that best explains how to move your business forward while keeping your audience engaged.
Turning Data into Action: Story-Driven Market Research Reports
Visually-Driven Reporting
MD Analytics offers exceptional visually-driven reports that can be customized using our high-quality reporting template or your own company branded version.
Enhanced Custom Infographics
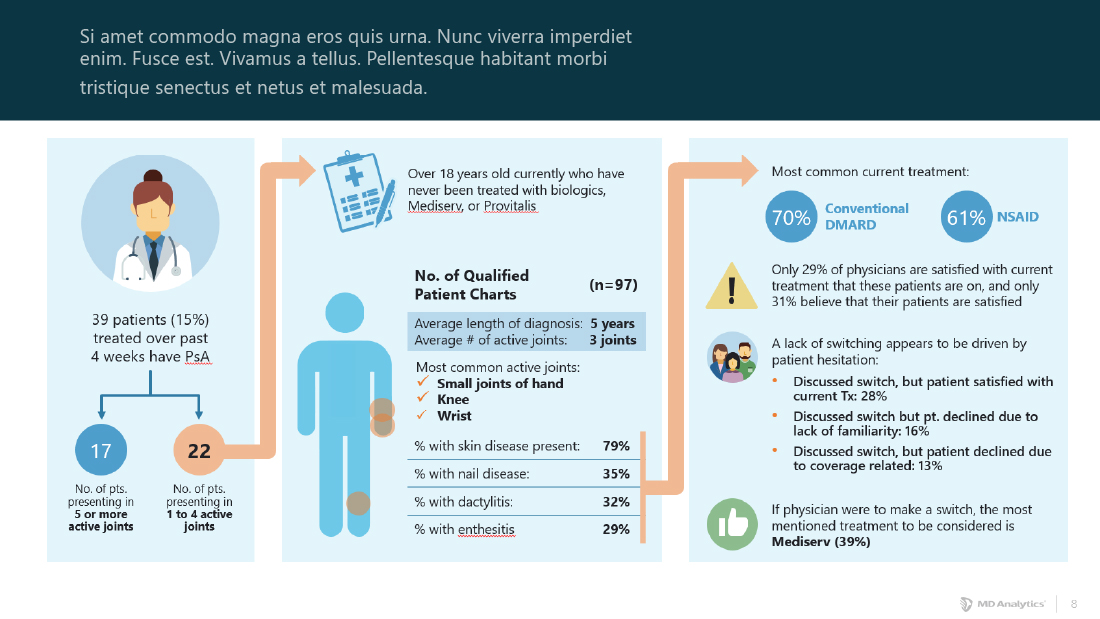
Easily share your market research results with all stakeholders via a custom infographic. An optional one-page summary with advanced visuals and story-telling insights in an accessible, illuminating infographic.
TANGIBLE COLLATERAL
MICROCONTENT FOR SHARING
A user friendly, visually appealing asset – something your organization will want to share and talk about
