
A chart audit goes beyond asking physicians how they usually treat a condition. It asks them to review real patient records and document what happened case by case: the diagnosis, the treatment chosen, the outcome and the reasoning behind each decision. The result is a more detailed view of real-world care, but getting there takes considerably more time and effort from participating physicians.
In March 2026, we surveyed 150 U.S. and 139 Canadian physicians about their willingness to take part in chart audits and what could hold them back. The biggest barrier in both countries was not access to records or concern about patient data. It was time.
Physicians already turn down about half the studies they are invited to. And chart audits are a more complex process than an online survey.
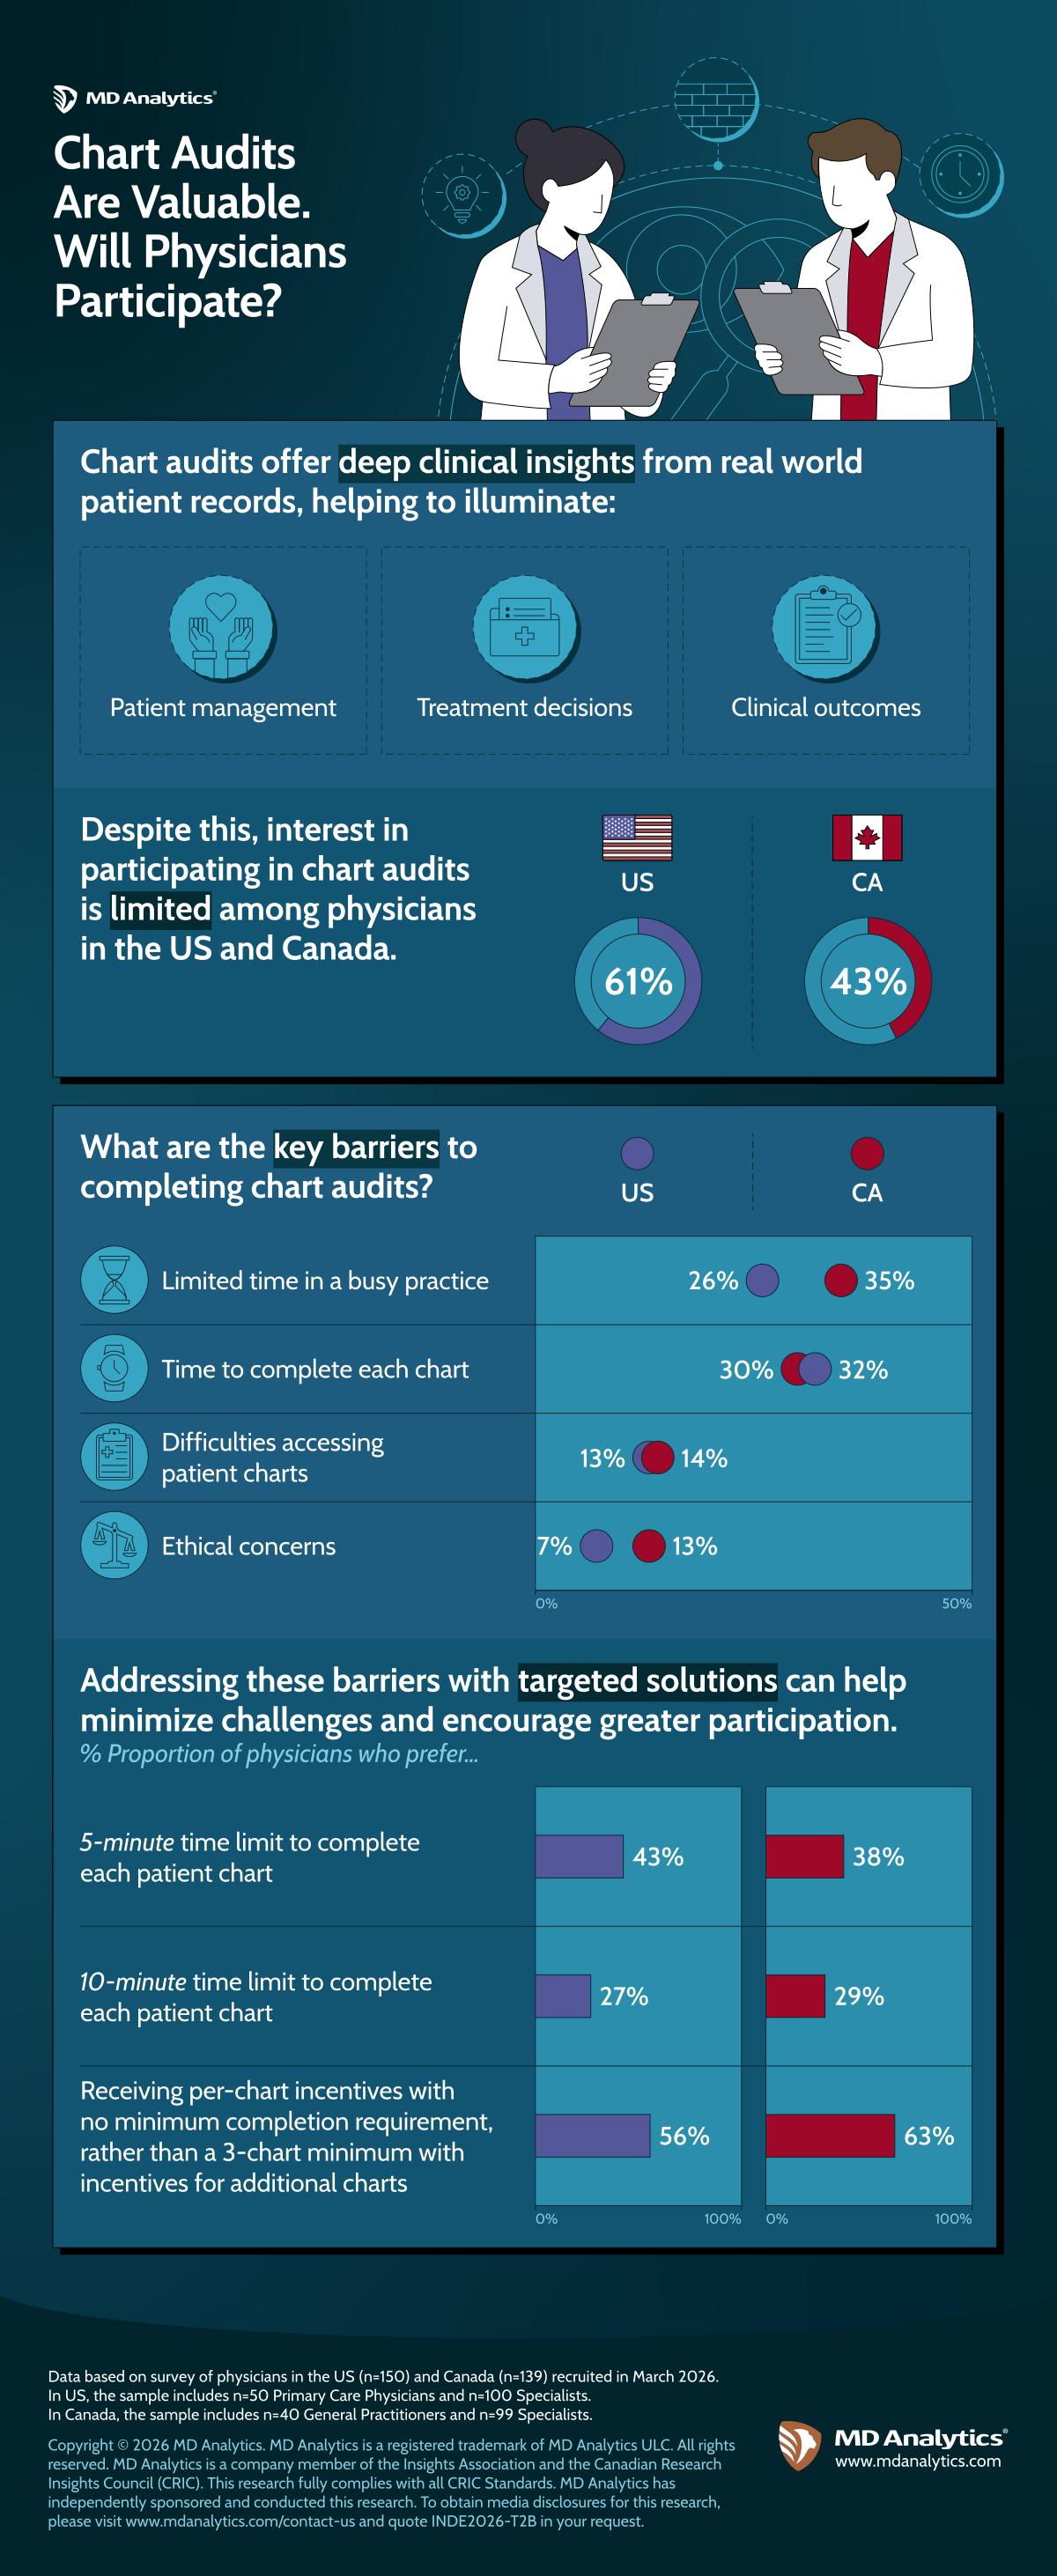
Research teams tend to build chart audits around the objections they expect to hear: that physicians can’t easily bring up their records, or that they’ll be uneasy about using patient data. Those actually turned out to be less of a concern in both markets. Difficulty accessing charts was raised by 13% of U.S. and 14% of Canadian physicians. Ethical concerns were raised by 7% and 13%.
What physicians raised instead was time. Just over a quarter of U.S. physicians (26%) and a third of Canadian physicians (35%) said they simply do not have room for it in a busy practice. Separately, 30% in the U.S. and 32% in Canada pointed to how long each individual chart takes to fill in.
Asked what per-chart time limit they would prefer, physicians in both countries chose five minutes most often: 43% in the U.S. and 38% in Canada. Ten minutes was the next most common answer, at 27% and 29%. Preferred survey lengths also vary by specialty.
The per-chart structure was preferred by 56% of U.S. and 63% of Canadian physicians. A three-chart minimum structure might be less attractive because it asks physicians to commit before they know how long one chart will take.
Designing chart research that balances clinical depth with physician feasibility requires strategic panel management and tested survey protocols. Contact our team to review the full dataset or to discuss how to structure your upcoming study for maximum engagement.
About this study
These findings come from an MD Analytics Independent Study, commissioned and conducted independently by MD Analytics. Data is based on a survey of physicians in the United States (n=150) and Canada (n=139) recruited in March 2026. The U.S. sample includes 50 primary care physicians and 100 specialists. The Canadian sample includes 40 general practitioners and 99 specialists. MD Analytics is a member of the Insights Association and the Canadian Research Insights Council (CRIC), and this research complies with all CRIC standards.
Infographics may contain select findings from our Independent Studies. Contact us to find out if your organization qualifies for a complimentary presentation with access to the full report.

Ready to explore how data-driven insights can accelerate your pharmaceutical research? Connect with our team to discuss your goals.
We use cookies to collect information to help us personalize your experience and improve the functionality and performance of our site. By continuing to use our site, you consent to our use of cookies. For more information, see our Cookies Policy.
